

Introduction
Microarrays are the most advanced tools in the post-genomic era to provide insight into the activities of almost all possibly envolved genes of the human genome. Biopsies of tumours, inflamed tissue or whole blood are investigated in the attempt to decipher the molecular network of these complex biological systems. However, functional interpretation of microarray results is a major hurdle and most analyses reflect a multivariate and statistical grouping of genes or a diagnostic classifying of patients and disease conditions. It is obvious that biological information about the role of the vast majority of the analysed genes is missing or not sufficiently retrievable. Thus, it will need a constant process of development and scientific discussion to improve this situation.
In NGFN-1, bioinformatics was performed in each individual group, providing experience of the many facets of microarray data analysis to each partner in our consortium. To improve interpretation, it is now essential to harmonize the standards for analysis, to share results, to exchange experimental information and to analyse comparatively. Although this process was initiated in NGFN-1 by collating and comparing candidate genes from different partners, it will be the major task in the next years to build up systematic collections of array data and to provide platforms for data presentation and retrieval. Therefore, in NGFN-2 the SIPAGE consortium has organized bioinformatics and data management as a central work package.
Results/Project Status
Data repository and retrieval system
As a platform tool for array analysis, an oracle database module was designed for Affymetrix GeneChip experiments to collate standard parameters provided by the software tools GCOS 1.2 and RMA for signal generation and/or pairwise analysis. Subsequent steps of group comparisons and filter criteria for candidate selection were implemented according to a consensus standard between the participating groups.
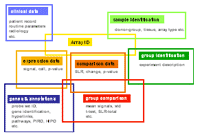
This database will now enable the participating groups to share data and provide a cross-linking of functional information for individual genes or sets of genes based on their regulation in different experiments, biological models or diseases. For example, profiles of different highly purified cell types from peripheral blood including monocytes, CD4+ T-cells, CD8+ T-cells, CD19+ B-cells, granulocytes and natural killer cells were generated in another project. These standardized signatures serve as reference to recognize if differentially expressed genes may originate from a particular cell type. This is essential if samples like whole blood, biopsies from inflamed tissues or tumours are investigated and cellular composition is changing.
Functional profile components
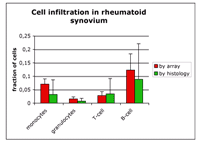
Variability of cell infiltration in tissue samples and changes in the differential blood count are typical problems related with clinical samples. As a consequence, differentially expressed genes identified by conventional comparison analysis are predominantly reflecting the changes of cellular composition. Using the standardized signatures of individual cell types, a functional profile component analysis (FPCA) was developed. This technique allows to estimate the fraction of the different cell types in each clinical sample individually.
Based on this information and the standardized signatures, each individual tissue profile is normalized to suppress heterogeneity of its cellular composition. Finally, intensity and probability for a regulation is calculated for each gene. This opens a new view on expression data of an individual sample by separating into genes that are related to changes of the cellular composition and into genes that are possibly involved in the molecular processes of the disease. Subsequent to the identification of functional components, further analyses are necessary to identify molecular changes which are a common characteristic of a group of patients with a defined disease or a characteristic clinical pattern and do not only represent an individual phenotype of one patient.
Tools for statistics, clustering, classification and prediction
For Affymetrix GeneChips, the GCOS 1.2 software package provides different parameters for comparison of expression profiles. These include signals, probabilities for the expression of a particular gene and pairwise array comparison parameters with the signal log ratio (SLR) for the magnitude and the statistical change call for the probability of a difference. Based on these data, we perform routinely parametric statistical tests, calculate the percentage of increased and decreased pairwise comparisons and use the average of the SLR for ranking and filtering genes. Furthermore various other tools from www.bioconductor.org are available and applied when needed. They are programmed as packages in R and can be integrated in our oracle database module.
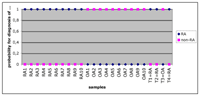
To identify genes for classification, a discriminant function similar to the prediction analysis for microarray (PAM) was programmed and applied on individual genes. This enables to retrieve for best classifying genes and to combine these for pattern recognition and predictive diagnosis. This workflow was successfully tested for the differentiation between rheumatoid arthritis and osteoarthritis based on synovial expression of 24 different genes.
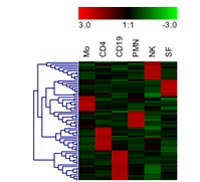
For visualization of patterns and grouping of similar samples, hierarchical clustering combined with heat maps has become the dominant tool in our group. This is demonstrated in figure 4 for the genes differentially expressed in various immune cell types and fibroblasts.
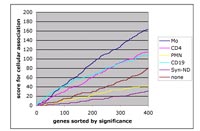
Although many more statistical tools are developing, we have experienced that major effort is needed for the identification and collection of biologically meaningful annotations for a given gene. Unfortunately, this information is insufficiently structured and developed and will depend on the systematic collation of standardized profiles. In a joined effort between various groups of the SIPAGE network, we have achieved this for the annotation of preferred expression of a given gene in one of the major leukocyte subpopulations or a number of purified and functionally defined mesenchymal cells including precursor cells, typical fibroblasts and chondrocytes. Based on these data, a scoring system can be applied to estimate the functional importance of a cell type in any given sample of inflamed or cancerous tissue (fig. 5).
In a similar way, gene annotations for relatedness to diseases, clinical characteristics or experimental parameters are currently built.
Outlook
The development of structured knowledge and systematic profile collections is a critical step towards the identification of diagnostic markers. These are needed to signal predisposition for a disease, severity of illness, therapeutic responsiveness and outcome (PIRO). Furthermore, inducible signatures will be necessary to identify and examine proinflammatory signal networks. Based on the modular structure of the annotation network and data sets from unstimulated and stimulated cells, it will be possible to use systems biology approaches to model the dynamic and complex network interactions of pathways and to allow a higher-order perspective on inflammation. This will eventually help to identify the underlying pathomechanisms and etiologies of the so far insufficiently understood diseases of acute (septic) and chronic (rheumatic) destructive inflammation.
Lit.: 1. Burmester GR, Häupl T. Strategies using functional genomics in rheumatic diseases. Autoimmun Rev. 2004 Nov;3(7-8):541-9. 2. Häupl T, Krenn V, Stuhlmuller B, Radbruch A, Burmester GR. Perspectives and limitations of gene expression profiling in rheumatology: new molecular strategies. Arthritis Res Ther. 2004;6(4):140-6. 3. Krenn V, Petersen I, Häupl T, Koepenik A, Blind C, Dietel M, Konthur Z, Skriner K. Array technology and proteomics in autoimmune diseases. Pathol Res Pract. 2004;200(2):95-103.