

Introduction
Chromosomal aberrations can be detected in approximately 50% of adult patients with acute myeloid leukemia (AML)1,2. Some of these chromosomal aberrations are balanced translocations leading to the generation of novel fusion proteins with aberrant function. The majority of aberrations represents genomic imbalances resulting from e.g. trisomies, monosomies or deletions. Despite extensive international efforts there is little progress in characterizing the minimally deleted (e.g. on chromosomes 5 and 7) or gained (e.g on chromosome 8) regions and in identifying the genes affected by these unbalanced aberrations.
Approximately 10 to 15% of AML cases exhibit complex karyotypes, i.e., three or more chromosomal aberrations. Many of these cases cannot be accurately described using the conventional chromosome banding analyses due to the low resolution of the technique and the complexity of the rearrangements (e.g. additional material of unknown origin, marker chromosomes, ring chromosomes). In AML, the use of molecular cytogenetic techniques, such as fluorescence in situ hybridization (FISH; high-resolution method, useful only for the detection of well known or suggested genomic aberrations) and conventional comparative genomic hybridization (CGH; screening method, very low resolution [3-10 Mb]), has not been helpful in identifying new regions of interest.
The novel chip-based technique termed microarray-CGH (mCGH) may circumvent some of these problems.3 The chromosome targets are substituted by well-defined genomic DNA fragments cloned in various types of vectors (e.g., BACs, PACs, cosmids, plasmids). The technique has been modified with regard to automation and array size and now allows high-resolution genomic screening of thousands of defined DNA targets in a single experiment.4-6 The spatial resolution of mCGH is highly superior to that of chromosomal CGH. Resolution is limited mainly by the size of the spotted DNA fragments. Using BACs or PACs as targets, single-copy number changes can be detected with a resolution similar to that of interphase FISH in a single hybridization experiment. It is expected that the application of mCGH to AML with complex karyotypes may contribute to i) the identification of novel recurrent genomic imbalances; ii) the characterization of commonly deleted or gained segments; and iii) the identification of high-level DNA amplification harboring novel candidate disease genes.
Project Status
mCGH
In close collaboration with the group of P. Lichter (Division of Molecular Genetics, Deutsches Krebsforschungszentrum, Heidelberg)3,6-10, we have recently developed a high-performance whole-genome microarray 2.8 k chip.9,10 It consists of 2799 different human genomic DNA-fragments cloned in bacterial artificial chromosome (BAC) or P1-derived artificial chromosome (PAC) vectors. 1502 of these clones cover the whole human genome with a physical distance of approximately 2 Mb; the remaining 1297 clones either contiguously span genomic regions known to be frequently involved in hematologic malignancies (e.g. 1p, 2p, 3q, 7q, 9p, 11q, 12q, 13q, 17p, 18q) or represent known cancer-related genes. This chip design allows a genome-wide analysis of genomic imbalances at a resolution of about 2 Mb in the contiguous regions the expected resolution will be even much higher.
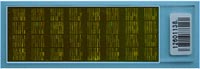
Recently, the group of P. Lichter has developed a mCGH chip (NGFN SMP1) for the high-resolution, genome-wide analysis of DNA copy number, consisting of more than 6000 unique genomic DNA clones (BACs, PACs and cosmids) spotted in triplicates on a single microarray chip (Fig. 1). 3200 of these clones map at 1 Mb intervals throughout the human genome. This clone set was originally selected and still is supported by the Sanger Center, UK. About 1800 clones were selected by the group of P. Lichter to cover known tumor suppressor and oncogenes, as well as genes involved in important cellular pathways. Another 1000 clones are covering regions frequently affected by chromosomal aberrations in human tumors. The combination of these clones on one chip makes it possible to simultaneously screen for new aberrations at a resolution of 1 Mb or higher, to analyze the copy number status of potential pathogenesis-relevant genes, and to fine map recurrent chromosomal aberrations in a single experiment.
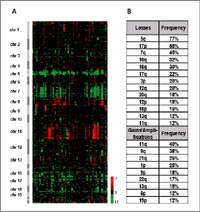
So far we have analyzed sixty AML cases with complex karyotypes using the mCGH microarrays which we have described above. In general, genomic losses were found more frequently than gains; the most frequent losses affected 5q (77%), 17p (55%), 7q, (45%); followed by losses of 16q (32%), 18q (30%), 17q (22%), 3p and 12q (20% each), 20q and 12p (18% each), 18p (15%), 13q and 11q (12% each). The most frequent genomic gains affected 11q (40%) and 8q (38%); followed by gains of 21q and 1p (25% each), 9p (18%), 22q (17%), 13q (15%), 6p and 19p (12% each) (Fig. 2).
Furthermore, the critical segments could be in part delineated to genomic fragments of 0.8 to a few megabase pairs of DNA. In lost/gained regions gene expression profiling detected a gene dosage effect with significant lower/higher average gene expression levels across the genes located in the respective regions.
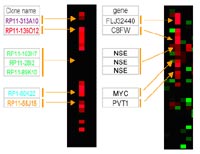
Furthermore, 41 high-level DNA amplifications in 19 different regions were identified; amplifications occurring in at least two cases mapped to (candidate genes in the amplicon) 11q23.3-q24.1 (n=7; ETS, FLI1); 21q22 (n=6; ERG, ETS2); 11q23.3 (n=5; MLL, DDX6); 13q12 (n=3; CDX2, FLT1, FLT3, PAN3); 8q24 (n=3; C8FW, MYC); 9p24 (n=2; JAK2); 12p13 (n=2; FGF6, CCND2); and 20q11 (n=2; ID1, BCL2L1). Parallel analysis of gene expression displayed overexpressed candidate genes in critical amplified region e.g. C8FW and MYC in 8q24 (Fig. 3)
Gene expression profiling
In a subset of 50 cases analyzed on both the 2.8 k and 6.0 k chip, we are currently performing global gene expression profiling. These analyses are performed in collaboration with Drs. L. Bullinger and K. Döhner in our laboratory. We are profiling global gene expression using high-density 40 k cDNA microarrays representing approximately 26.000 different UniGene clusters. This microarray platform is purchased through the Stanford Functional Genomics Facility in order to make a comparison with our previous gene expression data more feasible.11 Data analysis will be performed as previously described using both unsupervised (e.g. hierarchical clustering) and supervised (e.g. significance analysis of microarrays) methods, and results will be correlated with the mCGH data.
First findings show that the analysis of gene expression in parallel to our mCGH provides useful additional information regarding the delineation of candidate genes in genomic regions characterized by copy number alterations (CNAs). However, our results are still preliminary and for final data interpretation all samples will have to be analyzed first.
Lit.: 1. Mrozek K et al. Clinical importance of cytogenetics in acute myeloid leukemia. Best Pract Res Clin Haematol. 14:19-47, 2001. 2. Fröhling S et al. Comparison of cytogenetic and molecular cytogenetic detection of chromosome abnormalities in 240 consecutive adult patients with acute myeloid leukemia. J Clin Oncol. 20:2480-2485, 2002. 3. Solinas-Toldo S et al. Matrix-based comparative genomic hybridization: Biochips to screen for genomic imbalances. Genes Chromosom Cancer. 20:399-407, 1997. 4. Pinkel D et al. High resolution analysis of DNA copy number variation using comparative genomic hybridization to microarrays. Nat Genet. 20: 207-211, 1998. 5. Snijders A.M. et al. Assembly of microarrays for genome-wide measurement of DNA copy number. Nat Genet. 29:263-264, 2001. 6. Wessendorf S. et al. Automated screening for genomic imbalances using matrix-based comparative genomic hybridization. Lab Invest. 82:47-60, 2002. 7. Wessendorf S et al. Hidden gene amplifications in aggressive B-cell non-Hodgkin lymphomas detected by microarray based comparative genomic hybridization. Oncogene. 22:1425-1429, 2003. 8. Schwänen C et al. Automated genomic profiling in chronic lymphocytic leukemia using array based comparative genomic hybridization (matrix-CGH). Proc Natl Acad Sci USA. 101:1039-1044, 2004. 9. Rücker FG et al. Identification of Genomic Imbalances in AML with Complex Karyotype using Matrix-Based Comparative Genomic Hybridization. Blood 104: abstract 3382, 2004. 10. Rücker FG et al. Novel genomic imbalances identified in acute myeloid leukemia with complex karyotypes using matrix-based comparative genomic hybridization. Haematologica 90(S2): abstract 588, 2005. 11. Bullinger L et al. Use of gene-expression profiling to identify prognostic subclasses in adult acute myeloid leukemia. N Engl J Med. 350:1605-1616, 2004.