

Introduction
From a machine learning point of view, classification of gene expression patterns is a very particular task. Typically, training data consists of few samples (small number of experiments) but contains many variables (expression levels measured in each experiment). In this context classical machine learning methods may cause various difficulties [1]. For instance, statistical models, particularly those with many parameters, may overfit the training data. Thereby, they rather adapt to noise in the data than learn the desired phe¬no¬menon. Moreover, common machine learning methods do not provide an intuitive and biologically meaning¬ful explana¬tion of their results. Rather the single signatures typically determined to characterize specific phenotypes contain a set of biologically unfocused genes. It is very questionable, whether a single global signature optimized for classification power actually reflects the underlying biological mechanisms. In the context of clinical diagnosis, we expect phenotypically homogeneous groups of patients to carry differing gene expression patterns since differing biological mechanisms may lead to the same phenotype. Furthermore, we observe much redundancy in gene expression data, since co-re¬gu¬la¬ted genes are highly correlated. Thus, genes from biologi¬cal¬ly unfocused signatures may be replaced by biologically coherent ones with little loss in classifier performance.
Molecular Symptoms
In this research, we consider the task to recognize a parti¬cular group of patients presenting a specific phenotype. We call this group the disease group, to be separated from the control group. In Structured Analyses of Microarrays we suggest to determine several biological classifiers to detect the disease group. We particularly aim for classifiers with excellent specificity and accept classifiers with suboptimal sensitivity. This is in analogy with symptoms in clinical con¬text: symptoms are never present in healthy people, but are characteristic for certain patients. Therefore, we call these classifiers molecular symptoms. They allow for an additional, molecular stratification of patients according to patterns of their absence and presence.
In order to determine whether a signature is biologically fo¬cused, we need functional annotations for the genes present on the microarray in a systematic way. Structuring biological knowledge and systematic collection of gene function annotation are central goals of the Gene Ontology database [2]. Biological terms related to molecular functions, biological processes and cellular components are collected into a directed acyclic graph where each node represents a term and child-terms are either members or representatives of their parent-terms. Moreover, genes are attributed to GO-nodes according to their mole¬cular function, involvement into biological processes and locali¬zation within the cell.
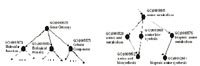
In Figure 1 we illustrate the Gene Ontology by depicting two small parts of the directed acyclic graph. On the left hand side of the Figure, the graph�s root is shown with its children. These children represent the major topics distinguished in the Gene Ontology, namely �mole¬cular function�, �biological pro¬cess� and �cellular component�. On the right hand side of the Figure, a few nodes from the bottom of the graph are shown and illustrate the fact that nodes may have several parents.
Results
We suggest to use the Gene Ontology to search for biologically focused classifiers. In order to obtain state-of-the-art performance, we aggregate these focused classifiers representing molecular symptoms as follows:
- For each GO-node with annotated genes, one local classifier is implemented using the nearest shrunken centroids method [3] on expression data of the anno¬tated genes.
- According to their classification performance each local classifier obtains a weight. We define a performance criterion analogous to the probability of misclassification.
- Results of children are collected in their parents by weighted sums using these weights, thereby compu¬ting probabilities for each class in each node.
- A shrinkage approach in a cross-validation setting is used to regularize weights such that uninformative branches of the classifier vanish.
This procedure generates a graph structured global classifier
according to GO's hierarchical structure. The overall classify¬cation result is provided by the root node's classifier. We describe our method in detail in [4].
We have implemented structured analysis of microarrays as an R package called stam [5]. It is compliant to the Biocon¬ductor suite of bioinformatics related R extensions [6]. Our implementation uses the R-package pamr which provides training, prediction and cross validation for the nearest shrunken centroids method for classification. The compu¬ta¬tion is performed in a postorder traversal of the Gene Onto¬lo¬gy. In a postorder traversal of a graph, all child nodes of a parent are treated before the parent. Thus we ensure that all data needed for training or prediction in a node are actually available. For the associations of probe-sets with GO terms and for the hierarchical structure of GO we rely on Bioconductor metadata packages.
Application to leukemia
In structured analysis of microarrays each classifier bases its decision only on information related to the biological aspect it
represents. Therefore, when considering an overall classifi¬cation result, its rationale can be deduced from the various classifier results. Actually, through the identified molecular symptoms associated to subsets of patients in the disease group, we obtain an additional molecular stratification of patients according to patterns of absence and presence of such symptoms.
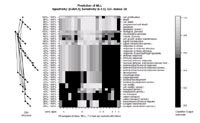
We have evaluated the method and our implementation on a large dataset from a study on acute lymphocytic leukaemia [7]. In this study Affymetrix HG-U95Av2 chips have been used to measure the gene expression profiles in bone marrow of 327 patients. We randomly split this data into training and test set. Figure 2 shows an example for molecular symptoms based patient stratification of the MLL sub type of acute lymphocytic leukemia (ALL) investigated in [7]. 20 MLL patients have been included in the study. We have trained StAM for detection of MLL on 217 of the available samples including 14 MLL cases. The 110 test
samples are classified without error in the root node.
Figure 2 is focused on the 20 MLL samples in the dataset. In the center of the figure the probability computed by classifiers in the classifier graph for each sample are shown as color code (see right hand side of the figure). In the image, rows correspond to GO-classifiers and columns reflect samples. The samples from the test set are marked with capital letters on the x-axis. Clustering this image in both directions brings similar classifiers and samples together. The graph to the left of Figure 2 shows the GO relations between the classifiers. The sensitivities and specificities given between the GO structure and the image are computed on the test set only. In Figure 2, bright regions represent presence, black regions absence of molecular symptoms.
We can group patients according to patterns of molecular symptoms. For instance, rows 2 to 6 in Figure 2 represent a molecular symptom related to apoptosis, which is present in all test samples except for sample G. Only in test samples A, B and C we observe the symptom driven by genes involved in antimicrobial humoral response. Effects in genes usually involved in skeletal development are observed in test samples A and B only, while samples B and C show untypical patterns for ALL in cell motility. Samples B and G have particular expression in synaptic transmission.
With structured analysis of microarrays, we propose an approach to augment microarray gene expression data through functional annotations provided by the Gene Ontology. We use the additional information to compute class predictions for many biological aspects. On various datasets we have found that our approach can deliver classification results of similar accuracy as state-of-the-art methods currently in use. In addition, structured analysis of micro¬arrays points to biological aspects relevant to the recognition of the investigated phenotype. We introduce the notion of molecular symptoms and illustrate their potential to provide an additional molecular stratification of patients.
Outlook
We plan to apply our method to various leukaemia related datasets and thus investigate a series of established clinically relevant phenotypes with the aim to uncover so far unrecognised molecular sub types.
Lit.: 1. T. Hastie, R. Tibshirani, and J. Friedman. The Elements of Statistical Learning. Springer Series in Statistics. Springer, New York, 2001. 2. M. Ashburner, C. A. Ball, J. A. Blake, D. Botstein, et al. Gene ontology: tool for the unification of biology. the gene ontology consortium Nat Genet., 25(1):25-29, May 2000. 3. R. Tibshirani, T. Hastie, B. Narasimhan, and G. Chu. Diagnosis of multiple cancer types by shrunken centroids of gene expression. Proc Natl Acad Sci USA, 99(10):6567-72, May 2002. 4. C. Lottaz and R. Spang. Molecular decomposition of complex clinical pheno¬types using biologically structured analysis of microarray data. Bioinformatics, 21(9):1971-8, May 2005. 5. C. Lottaz and R. Spang. stam - a bioconductor compliant r package for structured analysis of microarray data. BMC Bioinformatics, 6(1):211, Aug 2005.6. R. C. Gentleman, V. J. Carey, D. M. Bates, B. Bolstad, et al. Bioconductor: Open software development for computational biology and bioinformatics. Genome Biol, 5(10):R80, 2004. 7. E. J. Yeoh, M. E. Ross, S. A. Shurtleff, W. K. Williams, et al. Classification, subtype discovery, and prediction of outcome in pediatric acute lymphoblastic leukemia by gene expression profiling. Cancer Cell}, 1(2):133-143, Mar 2002.